
Automating schedule progress tracking for enterprise project controls
On large-scale industrial and infrastructure projects, schedule performance isn't just a progress metric—it's a direct driver of cash flow, contractual compliance, and project viability. Yet most project teams still update their schedules manually in Microsoft Project, export the data to spreadsheets, and roll up progress by hand. The result is schedule data that is perpetually two weeks stale, and progress reports that consume more engineering time to produce than they save.
This guide breaks down the specific failures of manual schedule tracking, and how an integrated schedule engine turns progress measurement from a reporting exercise into a real-time decision-support system.
The three critical problems with manual schedule tracking
Stale data kills proactive decision-making — Manual schedule updates happen weekly at best. By the time a project manager identifies a declining progress trend, the project has already consumed three weeks of float. Useful progress measurement requires live data tied to actual field updates—not a once-a-week update session.
Manual roll-ups introduce compounding errors — Rolling progress up a work breakdown structure means weighting thousands of activities by duration and summing them across levels. A single formula error in a shared spreadsheet propagates incorrect figures to every downstream report, and nobody catches it until a client review exposes the discrepancy.
Resource drain on project controls engineers — Generating a weekly progress report and S-curve manually on a complex project consumes 4–8 hours of a project controls engineer's time. Multiplied across a 24-month project, that's a significant portion of the controls budget spent on data assembly rather than analysis.
The schedule engine: core capabilities
Construway's schedule engine is built around seven integrated capabilities that automate the reporting cycle from schedule import to predictive forecasting.
Native MS Project import
Rather than forcing teams to abandon existing schedule workflows, the engine imports Microsoft Project XML. The file is validated by reading its contents, not by trusting the extension. The structured data model preserves WBS hierarchy, task dependencies, constraints, working calendars, and baseline dates—so the platform becomes the analytics layer on top of existing scheduling tools rather than a replacement. Every import runs through an upload, preview, and confirm cycle, so you see exactly what will change before anything is applied.
Planned and Reported Progress
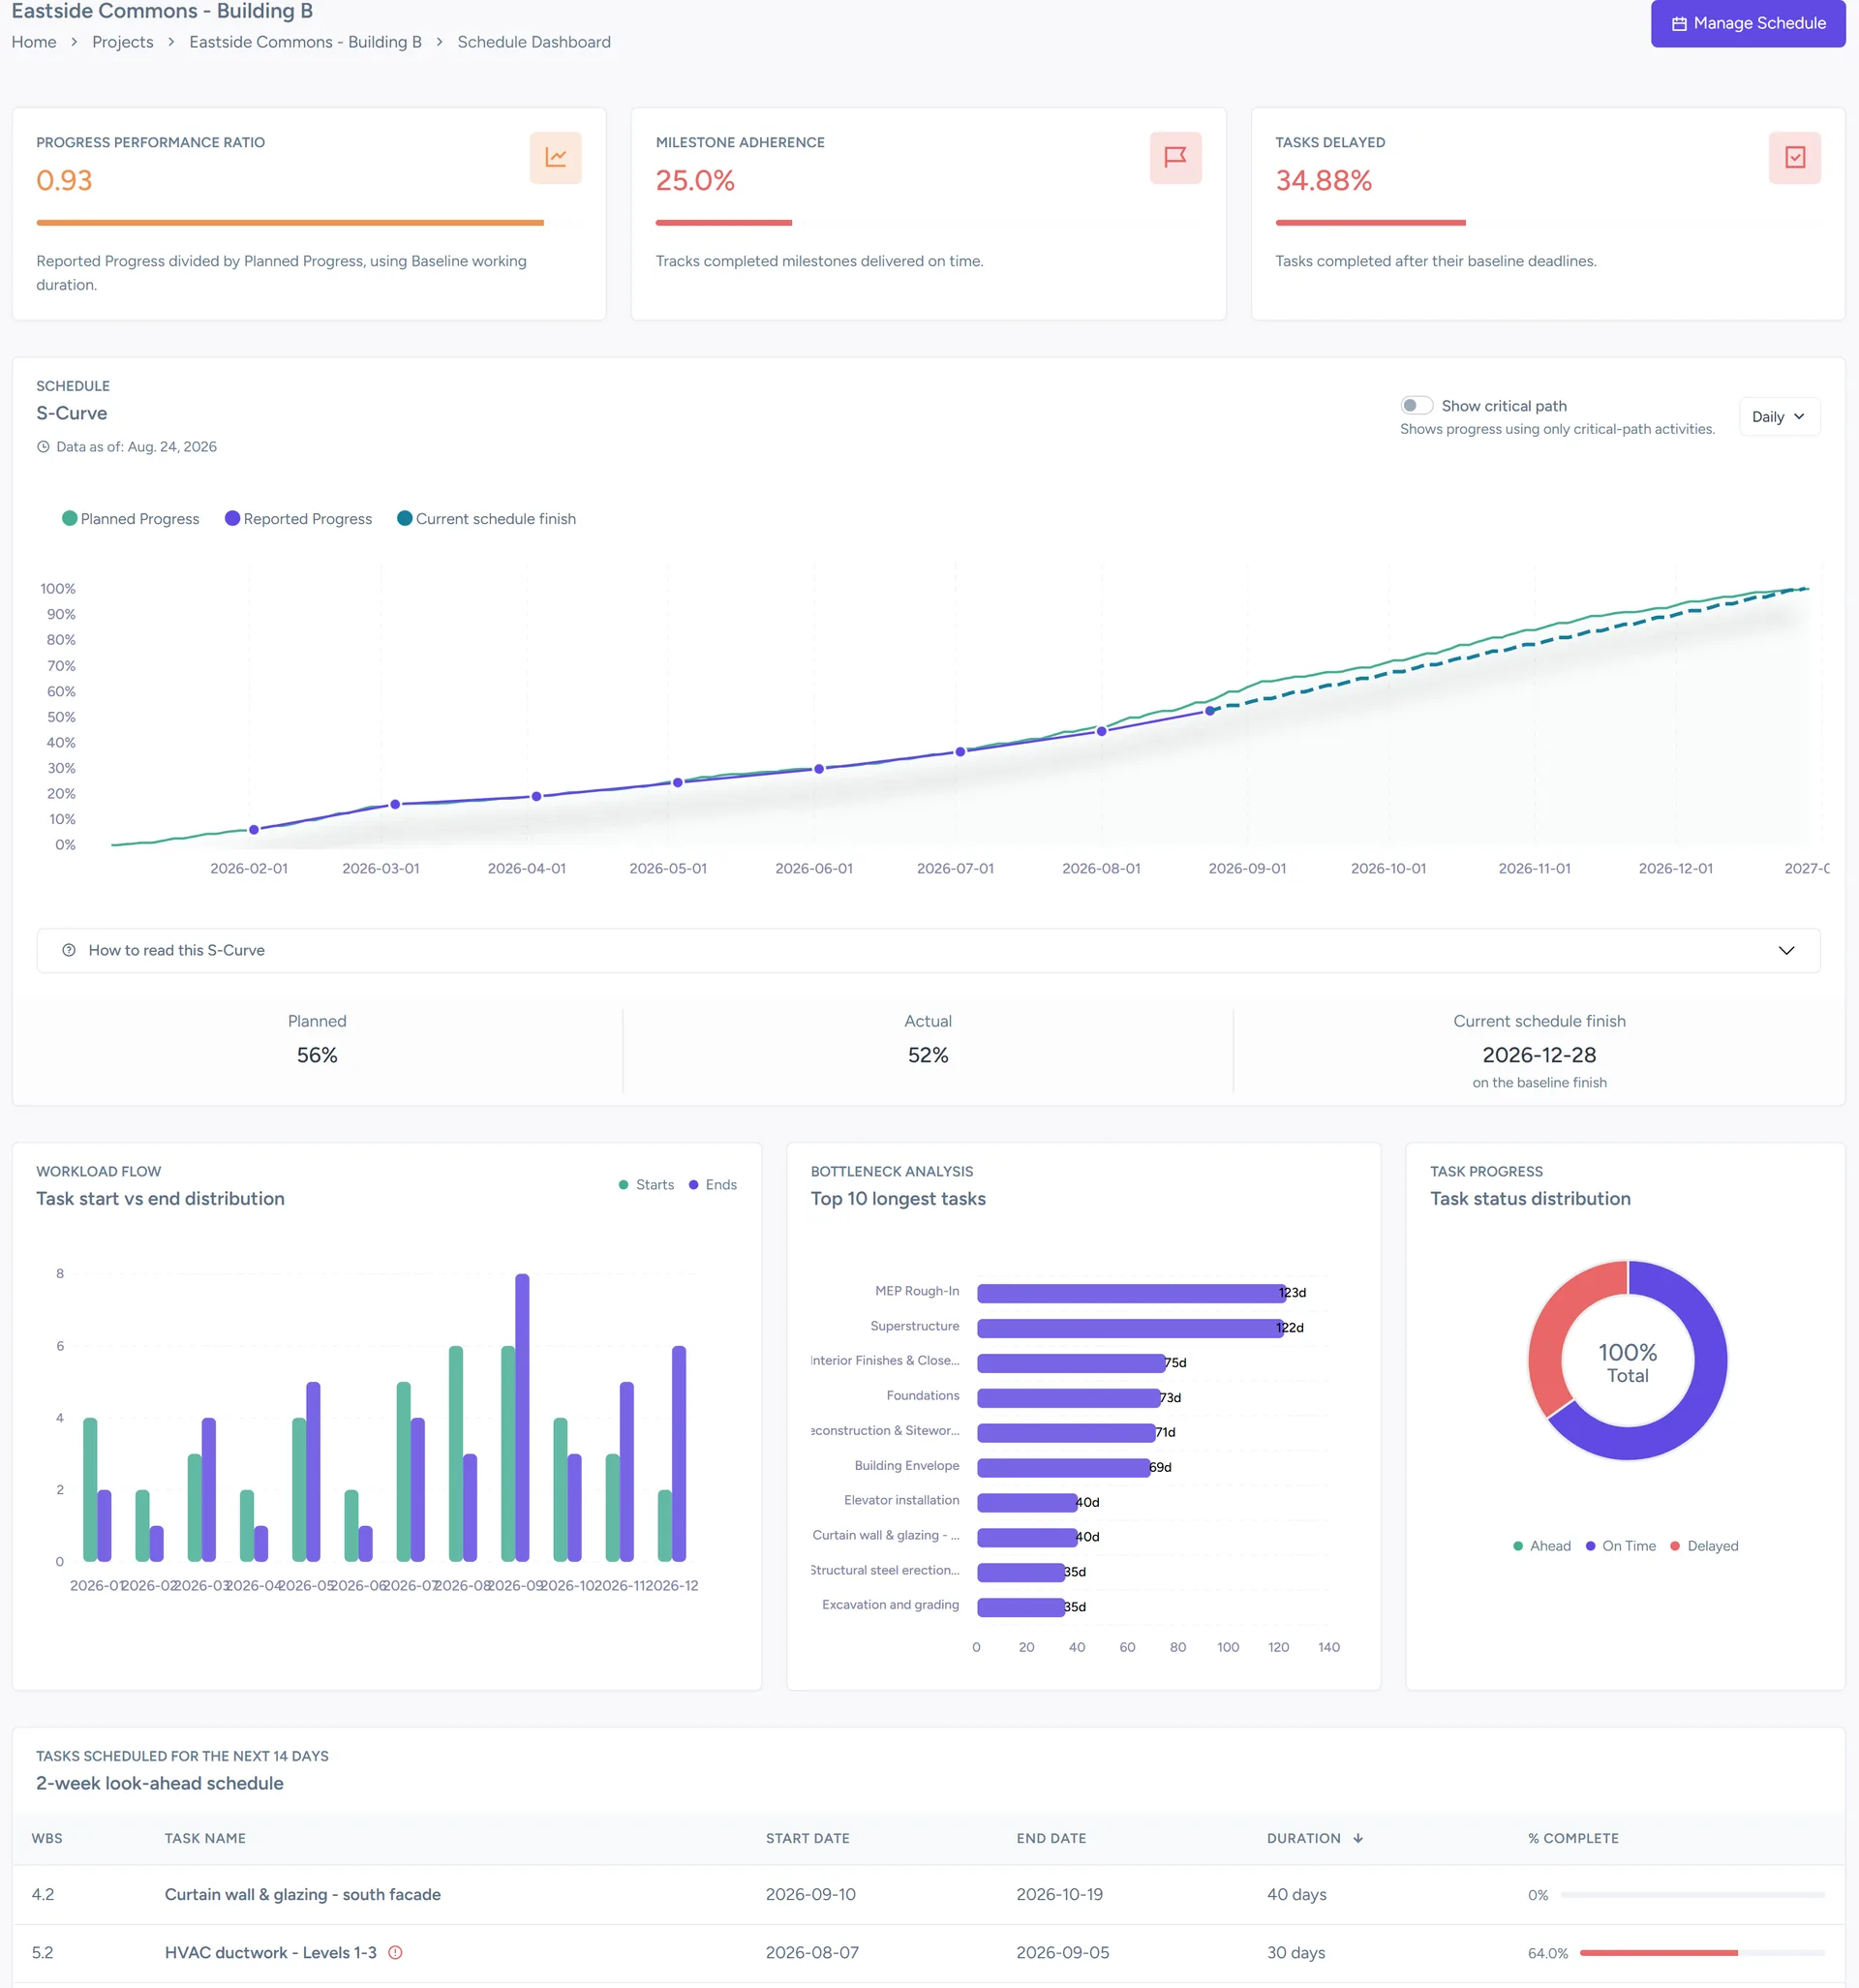
Construway measures two figures on every status date. Planned Progress is where the approved baseline says the work should be. Reported Progress is where the responsible party says it actually is. Their difference is the Progress Variance, expressed in percentage points; their ratio is the Progress Performance Ratio, where 1.00 is exactly on plan. Both are weighted by baseline working duration and computed in working time, so a two-week holiday shutdown does not read as a two-week slip.
These are schedule measures, and Construway is deliberate about that: they are derived from the schedule and its baseline, not from a budget. Where a cost baseline is what you need, that lives in the separate cost control module, with its own committed, actual, and estimate-at-completion figures.
Dynamic S-curve generation
S-curves are generated automatically from schedule data, showing cumulative planned versus reported progress over time, at daily, weekly, monthly, or yearly granularity, with an optional critical-path-only view. For project owners and lenders, this provides the standardized performance visualization required by most capital project reporting frameworks without requiring a separate graphics tool.
Predictive completion forecasting
The engine applies the current Progress Performance Ratio to the remaining work volume to project an expected finish date. This gives project directors the quantitative basis to distinguish between recoverable schedule slippage and structural delays that require scope adjustment or resource reallocation before the contractual completion date is at risk.
Two-week look-ahead
A rolling two-week look-ahead extracts the near-term work plan from the master schedule. This bridges the gap between the long-range Gantt chart and field execution—giving superintendents a daily and weekly view of what must be resourced and mobilized in the immediate term.
Baseline adherence and float tracking
Every schedule update is compared against the locked baseline. Construway runs its own critical path calculation—forward pass, backward pass, total float and free float—across all four dependency types and eight constraint types. Float consumption, slippage on critical path activities, and milestone date drift are flagged automatically. This enforces schedule discipline and provides an early warning system before critical path compression becomes a crisis.
WBS-level drill-down
Progress metrics are available at every level of the Work Breakdown Structure. A portfolio-level view shows overall project health; a discipline-level view identifies which areas are driving the variance; a work package view provides the granular data needed for field crew deployment decisions.
Core data model for schedule intelligence
The schedule data model is designed to support both current-cycle reporting and longitudinal analysis across the project lifecycle.
Activity-level performance records — Each schedule activity carries a complete history of planned versus actual start and finish dates, progress progression, and its provenance—whether a figure came from the planner's file, was derived from the baseline, or was reported by the responsible party. This identifies which activity types consistently underperform against plan.
Baseline provenance — Baseline dates record where they came from: an MS Project baseline or a manual entry. When scope changes or contract amendments move the measurement baseline, the before-and-after comparison is explicit rather than inferred.
Status dates — A schedule is a dated photograph, not a document you overwrite. Each status date stores its own snapshot, one per project per day, so progress is comparable across reporting cycles instead of being lost to the last update. Snapshots can be carried forward and adjusted.
Predictive forecasting: from reactive to proactive controls
The highest-value capability of automated progress tracking is not the metrics themselves—it is the ability to forecast future performance before problems become visible in the field.
When the Progress Performance Ratio falls below a defined threshold across the schedule, the platform flags the divergence and recalculates the expected completion date by applying the current ratio to the remaining duration. Project managers can consult that forecast and intervene with resource reallocation or look-ahead adjustments before the variance becomes a contractual issue—not after the client identifies it in a monthly progress meeting.
This is the fundamental shift that automation enables: from documenting what happened to predicting what will happen if current trends continue.
Conclusion
Manual schedule tracking and hand-built progress roll-ups are not just inefficient—they are structurally incompatible with the decision-making speed that complex industrial projects require. By the time manual reports are assembled and distributed, the conditions they describe have already changed.
An automated schedule engine with native MS Project import, working-time progress measurement, in-house critical path analysis, dynamic S-curves, and predictive forecasting transforms schedule management from a reporting burden into a live decision-support system that protects margins and enables proactive project leadership.
Ready to automate your project controls? Book a demo to see the schedule engine live.
Frequently asked questions
On every status date Construway compares Planned Progress — where the approved baseline says the work should be — against Reported Progress, where the responsible party says it is. The difference is the Progress Variance in percentage points; the ratio is the Progress Performance Ratio, where 1.00 is on plan. Both are weighted by baseline working duration and calculated in working time, so shutdowns and holidays do not distort the result.
No, and Construway is deliberate about the distinction. Earned Value indices are calculated against a budgeted measurement baseline. Construway's progress figures are derived from the schedule and its baseline, with no budget behind them, so calling them SPI or SV would be misleading. Cost performance is handled separately in the cost control module, which tracks committed, actual, estimate-to-complete and estimate-at-completion against a sanctioned budget.
No. The schedule engine imports MS Project XML, preserving WBS structure, dependencies, constraints, calendars and baseline dates. The platform functions as the analytics and visualization layer on top of existing scheduling workflows, and it will not silently recompute an imported snapshot — the planner's tool stays the document of record.
Related articles
Deep dives into the tools and strategies that keep capital projects on track.